What you need
- Your annual electricity consumption in kilowatt hours, shown on your last annual bill
- The roof orientation and the roof pitch in degrees
- The available roof area in square metres
- Optional: the data sheet of the modules you have been offered
1kWp and kWh: two quantities that are often confused
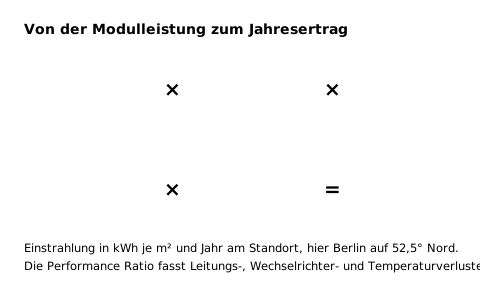
Kilowatt peak, abbreviated kWp, is a power rating. It describes what a module delivers under standardised test conditions: 1,000 watts of irradiation per square metre, a module temperature of 25 degrees Celsius and a defined light spectrum. These conditions rarely all occur at once in practice, so kWp is not a forecast but a benchmark that lets you compare modules from different manufacturers side by side.
A kilowatt hour, kWh, is an amount of energy: power multiplied by time. It is the quantity on your electricity bill and the one you want to replace with the system. A 500 watt peak module running for one hour under test conditions delivers 0.5 kilowatt hours.
Between the two sits the specific annual yield in kWh per kWp. It sums up how often and how strongly the sun shines on your surface at your location and how much of that reaches the meter after all losses. It is the only value you need to know to get from system size to yield.
The calculation is then simply: system size in kWp multiplied by the specific annual yield gives the annual yield in kWh. A 5 kWp system in Berlin with around 957 kWh per kWp therefore delivers about 4,800 kilowatt hours a year.
2Location sets the base figure
The specific annual yield depends first of all on location. SolarFinder derives irradiation from latitude and then applies orientation, tilt and losses. For a south-facing roof at optimum tilt this gives: Munich 1,101 kilowatt hours per kilowatt peak, Vienna 1,098, Cologne 998, Berlin 957, Hamburg 936.
Between Hamburg and Munich that is a difference of around 18 percent. That is more than the difference between a south and a south-west roof, so location is the stronger lever, and unfortunately the one you cannot change.
For a first estimate a rough classification is enough: northern Germany roughly 930 to 970, the middle 970 to 1,020, southern Germany and Austria 1,050 to 1,110. If you want it more precise, simply enter your town or postcode in SolarFinder and the app calculates with the actual latitude.
Orientation and tilt act as factors on this base figure. A south-west roof with 0.96 and a pitch of 30 degrees with 0.99 gives 957 times 0.96 times 0.99 in Berlin, so around 910 kilowatt hours per kilowatt peak. How to determine these two values for your roof is explained in the guide on roof orientation and tilt angle.
3From power to number of panels and roof area
A standard module today is rated at 400 to 500 watts peak and measures about 1.76 by 1.13 metres, so just under 2.0 square metres. Including frame and mounting clearance, practice works with around 2.2 square metres per module.
The number of panels follows directly: system size in watts divided by module power. For 5 kWp with 500 watt modules that is ten panels, for 3 kWp six, for 10 kWp twenty. The area follows from the number of panels times 2.2 square metres: 13, 22 and 44 square metres respectively.
On pitched roofs the usable area is smaller than the roof area. Clearances to ridge, eaves and verge, skylights, dormers, chimneys and safety distances typically eat up 15 to 30 percent. 60 square metres of roof quickly become 45 usable, enough for around 20 panels and thus 10 kWp.
Flat roofs follow a different rule. There the mounting frames stand free, but the rows must not shade each other. As a rule of thumb you need two to three times the module area when tilting towards the south; with a flat east-west arrangement considerably less, because the modules can sit close together.
4How big does the system need to be for my consumption?
The obvious idea, installing as much as I consume, is misleading. A system that covers annual consumption on paper does not cover it over the course of the day: it produces far too much at midday in summer and far too little in December.
For sizing, a different rule of thumb has therefore become established: around 0.3 to 0.4 watts peak per kilowatt hour of annual consumption if no storage is planned. A household with 3,500 kilowatt hours ends up at 1.0 to 1.4 kWp, which is the size of a balcony solar system and mainly covers the base load.
With storage, a heat pump or an electric car the figure shifts clearly upwards. Then you reckon with 1.0 to 1.5 watts peak per kilowatt hour of annual consumption, because a larger share of the summer surplus can actually be used.
And finally there is the opposite view: simply fill the roof. Because mounting costs per module fall with system size and the feed-in tariff at least pays for the surplus, the larger system is often the more economical one, even if the self-consumption share drops. Which path is better depends on whether you optimise for maximum return or maximum independence.
5The annual curve: why winter contributes so little
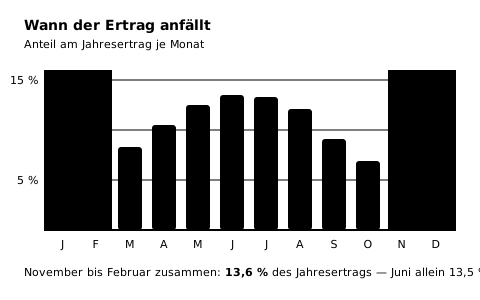
The annual yield is distributed extremely unevenly. SolarFinder uses monthly shares of 2.2 percent in January, 4.0 in February, 8.3 in March, 10.5 in April, 12.5 in May, 13.5 in June, 13.3 in July, 12.1 in August, 9.1 in September, 6.9 in October, 4.8 in November and 2.6 in December.
That means the four months from November to February together deliver 13.6 percent of the annual yield, exactly as much as June alone. Anyone hoping for self-sufficiency in December is counting on a twentieth of the June output.
In practice, for a 5 kWp system in Berlin with around 4,800 kilowatt hours a year, that means about 648 kilowatt hours in June, so a good 21 per day, and about 125 in December, so a good four per day. And that December figure is an average: on an overcast day it is less than one kilowatt hour, on a clear frosty day considerably more.
This distribution is why a photovoltaic system in Central Europe cannot provide a full supply and why seasonal storage with batteries does not work. A battery bridges the night, not the winter.
6What the performance ratio swallows
Between the radiation falling on the modules and the electricity passing through the meter lie several sources of loss. They are combined into one figure: the performance ratio. SolarFinder uses 0.82, which corresponds to a well-designed rooftop system.
The largest share is temperature. Modules lose about 0.35 percent of output per degree above 25 degrees Celsius. On a hot summer day the back of the module reaches 60 to 70 degrees, which costs 12 to 16 percent. That is exactly why many systems deliver more in May than in July.
Add to that the inverter efficiency of 96 to 98 percent, cable losses of one to two percent, soiling of one to three percent depending on tilt and location, and mismatch tolerances in the string wiring when modules differ in output.
Systems with poor rear ventilation, such as in-roof systems or modules glued flat onto metal sheeting, tend towards 0.78; very well ventilated ground-mounted arrays reach 0.85. Anyone comparing a forecast should therefore always ask which performance ratio was used. The difference between 0.78 and 0.85 is almost nine percent of annual yield.
7Inverter sizing and the 60 percent rule
Two things limit how much of the generated energy actually reaches the meter: the sizing of the inverter and regulatory feed-in limits.
Undersizing the inverter is common and sensible. A 4 kW unit on a 5 kWp system, a ratio of 0.8, only clips the rare peaks. Because full load is almost never reached in Central Europe, this costs less than one percent of annual yield and saves noticeably on purchase costs. SolarFinder models this: if you enter the inverter power, you see the clipping directly in the result.
The second limit is legal. In Germany, since the beginning of 2025, new systems are limited to feeding in 60 percent of installed capacity as long as no smart metering system is installed. With a smart meter or under direct marketing the limit does not apply. This is the regulation many people search for under “60 percent rule”; the older 70 percent rule that applied until 2023 no longer exists for new systems. Other countries have their own rules, so check with your grid operator.
The important distinction: it is feed-in that is limited, not generation. What you consume yourself does not count against the limit. For a household with high self-consumption or with storage the loss is therefore small. Regulations change regularly, however, so have the current status confirmed by your grid operator before sizing around it.
8Why calculators give different figures
Enter the same roof into three calculators and you get three results. This is rarely due to errors and almost always due to different assumptions.
The first source is the irradiation data. Some tools use satellite data such as PVGIS, others calculate with a climate model based on latitude. Both are legitimate, but for the same location they deviate by five to ten percent, if only because they average different reference periods. SolarFinder calculates with a latitude model and can optionally use PVGIS hourly data; the two figures differ, and in any discussion of a quote it should always be stated which one is meant.
The second source is the performance ratio. Between 0.78 and 0.85 lie almost nine percent, and many calculators do not state their value.
The third is the treatment of shading. No calculator can tell from a postcode whether a tree stands in front of the roof. Some apply a flat five percent shading loss, others none at all. For a roof that is actually shaded, both are wrong.
As a user, a simple rule helps: never compare the absolute figures of two calculators, but use one calculator to compare variants of the same roof. South or south-west, 4 or 6 kWp, with or without storage: such comparisons are reliable within one model, even if the absolute figure remains an estimate.
9A worked example from start to finish
A household in Cologne consumes 4,200 kilowatt hours a year. The roof faces south-west, has a pitch of 35 degrees and offers about 40 square metres of usable area.
Step one, the specific yield: Cologne delivers 998 kilowatt hours per kilowatt peak facing south at optimum tilt. South-west gives a factor of 0.96, and 35 degrees of pitch is practically at the optimum with 1.00. That leaves around 958 kilowatt hours per kilowatt peak.
Step two, the size: 40 square metres divided by 2.2 gives 18 panels. At 450 watts per panel that is 8.1 kWp.
Step three, the yield: 8.1 times 958 gives around 7,760 kilowatt hours a year, clearly more than the consumption of 4,200.
Step four, putting it in context: without storage, typically a quarter to a third of this is consumed directly, so 1,900 to 2,600 kilowatt hours. The rest goes to the grid. Whether filling the whole roof pays off therefore depends on the ratio of system price, electricity price and feed-in tariff, and on whether a heat pump or an electric car is added later, which would raise self-consumption.
10What the yield does over twenty years
All the figures so far describe a single year. But a photovoltaic system is built for two to three decades, and over that time the yield changes in two ways.
The first is module degradation. Crystalline silicon modules lose about one to two percent in the first year, a one-off effect on first exposure to light, and then around 0.4 to 0.5 percent annually. Manufacturers typically guarantee 84 to 87 percent of nominal output after 25 years. Averaged over the whole lifetime, the yield is therefore about 92 percent of the initial value. For a profitability calculation this means: anyone who extrapolates the first year's yield over 25 years overestimates the total by around eight percent.
The second change is the weather. The specific annual yield is an average; individual years fluctuate around it by plus or minus five to ten percent. A sun-poor year like 2010 was well below the average, a record year like 2018 well above. Over twenty years this evens out, but in the first year after installation it can cause concern if the system misses the forecast.
There is a third point of practical relevance that is often overlooked: the inverter rarely lasts as long as the modules. After twelve to fifteen years a replacement is usually due. Anyone drawing up a payback calculation over twenty years should budget for this replacement, which costs between 800 and 2,000 euros depending on system size.
Taken together this means: use the first year's yield to size the system, but about 92 percent of it when judging profitability over the lifetime, and allow for an inverter replacement somewhere in the middle.
11Common mistakes
Treating kWp and kWh as the same thing. The power rating on the module says nothing about how long the sun shines.
Calculating with the roof area instead of the usable area. Clearances, windows and dormers cost 15 to 30 percent.
Extrapolating the summer yield. June and December differ by a factor of five.
Sizing the system exactly to annual consumption. Annual consumption says nothing about the daily curve, and only that decides how much electricity is used on site.
Comparing absolute figures from different calculators. Different data sources and different performance ratios explain almost every deviation.
Confusing the feed-in limit with a generation limit. Only what goes to the grid is limited; self-consumption is unaffected.
Frequently asked questions
How many panels do I need for 4,000 kWh a year?
In central Germany one kilowatt peak delivers around 1,000 kilowatt hours a year. For 4,000 kilowatt hours you therefore need about 4 kWp; with 500 watt modules that is eight panels and around 18 square metres. In northern Germany more like nine panels, in the south seven to eight are enough.
How many solar panels is 5 kWp?
With today's usual 450 to 500 watts per module that is ten to eleven panels. With older 375 watt modules it would be 14. The area is around 22 to 25 square metres.
How much electricity does a 5 kWp system produce per day in winter?
Only 2.6 percent of the annual yield falls in December. With around 4,800 kilowatt hours a year that is about 125 kilowatt hours a month, so a good four per day on average. On overcast days less than one kilowatt hour remains, on clear frosty days considerably more.
What is the 60 percent rule for PV?
Since the beginning of 2025, new systems in Germany may feed at most 60 percent of their installed capacity into the grid as long as no smart metering system is installed; with a smart meter or under direct marketing the limit does not apply. Only feed-in is limited, not generation, so self-consumption does not count against it. As such rules change and differ by country, have the current status confirmed by your grid operator.
How do I calculate the solar yield for my location?
Take the specific annual yield of your location, between 930 in northern Germany and 1,110 in the Alpine foothills, multiply it by the orientation factor and the tilt factor of your roof and then by the system size in kWp. SolarFinder does exactly that as soon as you enter location, orientation, tilt and size.
Why does my calculator give different figures from the quote?
Almost always because of different assumptions: a different irradiation data source, a different performance ratio, a different shading assumption. Ask about both when you get a quote: which data source and which performance ratio were used. Between 0.78 and 0.85 lie almost nine percent of annual yield.
How much roof area do I need per kilowatt peak?
With today's modules around 4.5 square metres per kilowatt peak, so about two panels. On pitched roofs add 15 to 30 percent for clearances and obstacles, on flat roofs with south-facing frames two to three times as much because of the row spacing.
Should the inverter be as big as the system?
No. A ratio of about 0.8, so a 4 kW inverter on 5 kWp of modules, is common and costs less than one percent of annual yield, because full load almost never occurs in Central Europe. On east-west systems the inverter can be even smaller, because the two sides never deliver their maximum at the same time.
How much output does a solar system lose over the years?
After a one-off loss of one to two percent in the first year, around 0.4 to 0.5 percent annually. After 25 years typical guarantees are 84 to 87 percent of nominal output. For a calculation over the lifetime you therefore use about 92 percent of the first-year yield.